EARLY 2022 HEAT WAVES IN EUROPE AND CLIMATE CHANGE
Happé, T., Vautard R., the student team of the June 2022 XAIDA Summer School and the XAIDA project participants.
The summer of 2022 was pounded by a series of heat waves in Europe. The first, an outstanding early heat wave, took place in mid-June 2022 across Europe, mostly hitting Spain, France, but also other parts of Europe. The early character of the heat, in a crucial season for agriculture and ecosystems, is likely to have induced specific impacts on health and agriculture, which will need to be assessed. During the XAIDA Summer School in Trieste, students have studied the relation of this heatwave to climate change, and concluded that:
- climate change has increased the likelihood of extreme heat events in June, in all assessed regions
- climate change has led to an increase in magnitude of June heat extremes with at least 2 degrees C, in all of the assessed regions
the June 2022 heat extreme had higher impact due to the compounding effect of the ongoing Mediterranean drought
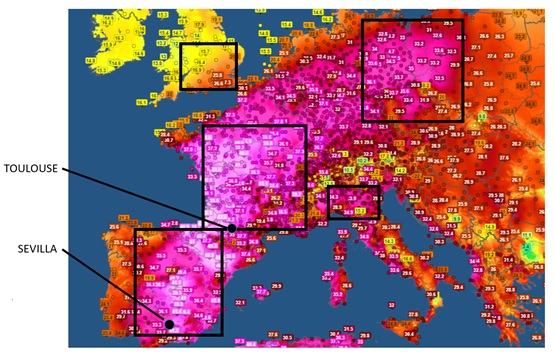
Figure1: Maximum temperatures recorded on 18/06/2022, together with the regions considered in this brief. Figure taken from the https://www.infoclimat.fr real-time portal.
Event and impacts
In mid June 2022, large parts of southern Europe experienced extreme temperatures with a high of 42.9 degrees C in Biarritz (France). The extreme temperatures observed were in many places far outside of the normal June temperatures, as evident in Figure 2. This heat originated from the Saharan region, flowing north due to the cut-off-low west of Portugal (Figure 3A). This dynamical pattern is similar to the June 2019 heatwave, where records were broken in several areas of Southern France too [1]. After June 20th, the cut-off-low stretched and moved inland, leading to severe thunderstorms in France. The high-pressure system stretched north-east, bringing the heat north of the Alps. A mere week after, there was yet another extended ridge structure (Figure 3B), leading to heat extremes stretching from southern Italy all the way to northern Norway.
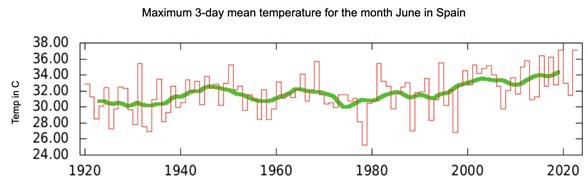
Figure 2. Spain June maximum temperatures, with a 3-day running mean, from the observational dataset E-OBS. The 2022 observed maximum temperature is far outside the normal range, with a value of 37 degrees C.
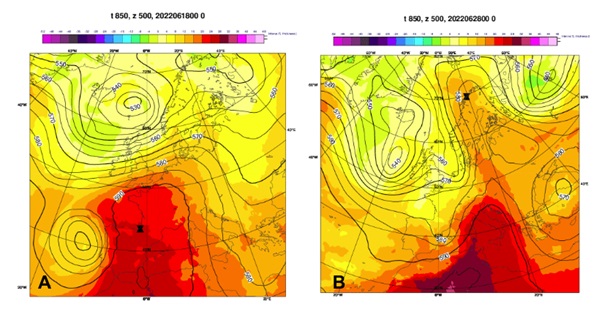
Figure 3. Surface temperature and geopotential height fields at 500hpa, for June 18 (A) and June 28 (B), please note the different spatial scales [2, 3].
The heatwave has affected multiple regions within Europe, likely inducing impacts ranging from increased mortality and health issues4, to forest fires in France5, electricity black outs in Italy6, and infrastructure breakdowns in France7. Due to the drought in the Mediterranean, the heatwave has even higher impacts. Italy was facing energy security issues, as a result of decreasing hydropower electricity production due the drought, which is especially worrisome with Italy trying to wean off Russia’s gas8. On top of that, the extreme heat caused an increase in energy demand, pushing electricity grids beyond their limits leading to blackouts in multiple cities6. Besides electricity, the agricultural sector is also hit hard by the compounding drought and heatwave conditions, potentially decreasing harvest by 30-40% in the Po Valley, Italy9. The Po Valley is an important agricultural region for both Italy and Europe, accounting for 35% of Italian agriculture10 and 50% of Europe’s rice11.
Links to climate change
The 6th IPCC assessment report stated that human induced climate change is the main driver of the increase in frequency and intensity of heat extremes (virtually certain)12. This increase in frequency and intensity of heat extremes will continue with rising temperatures12. For example, in the Mediterranean a one in 50 year heatwave event will become more than 15 times more likely under 1.5 degree warming, and more than 30 times more likely under 2.0 degree warming12. These statements raise the question whether the specific June 2022 heatwave, with its early character, has become more likely due to global warming.
Here, we compare the occurrences of extreme heat events from 5 different regions and 2 additional cities, as shown in Figure 1, in pre-industrial and present-day climate. This is called Extreme Event Attribution13, a method that allows for the attribution of a specific class of extreme events to climate change, examining changes in both its frequency and intensity.
Several approaches allow us to assess the role of climate change in the development of a specific event or class of event. First, the event is defined using one or several indices. Then, the “statistical” approach models the extreme values of the indices, as obtained from observations or climate simulations, using asymptotic extreme value distributions. Last, the calculated return periods in a factual and counterfactual climate are compared. The “storyline” approach, in contrast, simulates how the current event was modified by greenhouse gasses using sensitivity experiments on boundary conditions (Sea Surface Temperatures, greenhouse gases, etc…) in order to disentangle the role of climate change.
Here we used the statistical approach and focused on heat in the month of June in the previously mentioned areas in Europe. Yearly maxima of 1-day, 3-day, or 5-day June maximal temperatures are fitted using the Generalized Extreme Value (GEV) distribution, with a proxy of climate change as a covariate (here the smoothed global mean surface temperature), using the methodology developed in 13, which is the basis of rapid statistical event attribution (https://www.worldweatherattribution.org). This allows us to simulate distribution of extremes in the present-day climate and in a climate globally 1.2°C cooler (pre-industrial conditions) (see for example Figure 4). This is done for observational and model data, after which the return period, change in intensity, and change in probability, as well as their uncertainties, are calculated for the extreme event using a weighted average, accounting for both inter-model variability and sampling uncertainties.
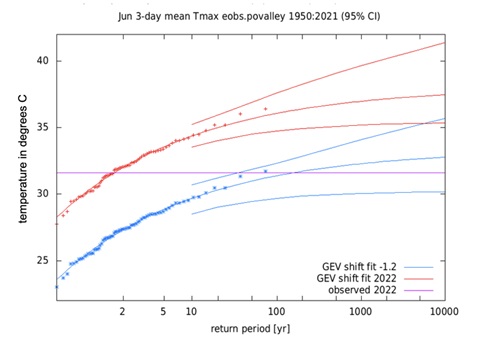
Figure 4. GEV fit for the Po Valley 3-day Tmax heatwave event of June 2022 (in purple), with red denoting the GEV distribution in present-day climate and blue for the pre-industrial climate. The y-axis is temperature in degrees C and the x-axis the return period in years.
This attribution is done for each of the five different regions and two different cities. The duration of the event varies in each case according to a preliminary analysis of observations, in which the duration that best characterized the amplitude of the extreme event was chosen. The results are summarized in Table 1 below, the full synthesis can be found in a separate Appendix. First of all, we can conclude that for all the examined areas the change in probability is positive, indicating that the heat extreme is more likely to occur due to human induced climate change. Secondly, all of the events have increased in intensity, indicating that events of similar probability have higher temperatures in the current climate.
The heatwave was especially extreme for Toulouse, France, with a return period in the current climate of once every 55 years. Without climate change, this would have been an event which would only occur at most once every 650 years, indicating that indeed this heatwave is largely attributable to human induced climate change.
Table 1. Synthesis from models + observations
Region/City | Return Period (current climate) | Change in intensity (in degrees C) | Change in probability (PR) |
France (5days) | 11 years |
| >10 |
Spain (3days) | 24 years |
| >100 |
South U.K. (3days) | 3 years |
[0.98 3.2] | ~2 [1.2 3.3] |
Northern Italy (3days) | 1.7 years |
| models and observations incompatible** |
Germany and Poland (1day) | 7.0 years |
| ~15 [4-600] |
Sevilla (5days) | 18 years |
| ~200 [1.5 10000] |
Toulouse (5days) | 55 years |
| ~200 [20 – 1000] |
** For Northern Italy (the Po-valley) the model simulations are not able to reproduce the temperatures observed during the heat extreme, therefore the synthesis is inconclusive.
Within the XAIDA project, we do not only focus on attribution studies, but we also aim to understand the dynamics behind the European heatwaves better. Using machine learning techniques, we investigate the causal drivers behind European heatwaves, and the role climate change has in altering unprecedented, record-breaking, and compounding heat extremes. We also develop storyline approaches, which allow us to project similar plausible events with higher magnitudes. After June, the summer of 2022 was followed by a series of heatwaves and by extreme drought, which will also be analyzed in various ways in XAIDA.
References
[1] Vautard et al 2020 Environ. Res. Lett. 15 094077
[2] ECMWF, 2022a https://confluence.ecmwf.int/display/FCST/202206+-+Heatwave+-+Western+Europe [accessed on 11 July 2022]
[3] ECMWF, 2022b
https://confluence.ecmwf.int/display/FCST/202206+-+Heatwave+-+Europe+2 [accessed on 11 July 2022]
[4] Extreme temperatures and health — European Environment Agency [accessed on 11 July 2022]
[5] France: Emergency crews responding to wildfires in Pyrenees-Orientales Department as of June 28 | Crisis24 [accessed on 11 July 2022]
[6] The Local, 23/06/2022. [accessed on 29 June 2022] https://www.thelocal.it/20220624/drought-hits-italys-hydroelectric-plants-amid-energy-crisis/
[7] Italy: Heatwave forecast over much of the country through at least June 24 | Crisis24 [accessed on 11 July 2022]
[8] The Local, 24/06/2022. [accessed on 29 June 2022] https://www.thelocal.it/20220623/italys-heatwave-to-last-another-week-and-get-even-hotter-say-forecasts/
[9] Huge crop losses expected as Italy endures prolonged heatwave [accessed on 11 July 2022]
[10] Borzì, I., Monteleone, B., Bonaccorso, B., and Martina, M.: Estimating the economic impacts of drought on agriculture through models and surveys in the Po river basin (Northern Italy), EGU General Assembly 2021, online, 19–30 Apr 2021, EGU21-12066, https://doi.org/10.5194/egusphere-egu21-12066, 2021.
[11] Siccità: Cia, già 30% riso a rischio. Subito ristori e no speculazioni [accessed on 11 July 2022]
[12] Seneviratne, S.I., X. Zhang, M. Adnan, W. Badi, C. Dereczynski, A. Di Luca, S. Ghosh, I. Iskandar, J. Kossin, S. Lewis, F. Otto, I. Pinto, M. Satoh, S.M. Vicente-Serrano, M. Wehner, and B. Zhou, 2021: Weather and Climate Extreme Events in a Changing Climate. In Climate Change 2021: The Physical Science Basis. Contribution of Working Group I to the Sixth Assessment Report of the Intergovernmental Panel on Climate Change [Masson-Delmotte, V., P. Zhai, A. Pirani, S.L. Connors, C. Péan, S. Berger, N. Caud, Y. Chen, L. Goldfarb, M.I. Gomis, M. Huang, K. Leitzell, E. Lonnoy, J.B.R. Matthews, T.K. Maycock, T. Waterfield, O. Yelekçi, R. Yu, and B. Zhou (eds.)]. Cambridge University Press, Cambridge, United Kingdom and New York, NY, USA, pp. 1513–1766, doi:10.1017/9781009157896.013
[13] Philip, S., Kew, S., van Oldenborgh, G., Otto, F., Vautard, R., & van der Wiel, K. et al. (2020). A protocol for probabilistic extreme event attribution analyses. Advances In Statistical Climatology, Meteorology And Oceanography, 6(2), 177-203. doi: 10.5194/ascmo-6-177-2020
![]() This project has received funding from the European Union’s Horizon 2020 research and innovation programme under grant agreement No 101003469.
This project has received funding from the European Union’s Horizon 2020 research and innovation programme under grant agreement No 101003469.