DESPITE GLOBAL WARMING, COLD SPELLS SUCH AS WITNESSED IN THE 1980’s IN WESTERN EUROPE ARE STILL POSSIBLE
Sebastian Sippel, Marlene Kretschmer, Ted Shepherd, Pascal Yiou, Robert Vautard, and the XAIDA team
Key messages
- Extreme cold spells are still possible today in Western Europe, even with current warming trends.
- The atmospheric circulation patterns that drive extreme low temperatures, e.g. as in January 1985, remain possible in current winters.
- Under such conditions we anticipate that with current regional warming trends, temperatures would only be about 1.4°C warmer than in 1985, with potential impacts on the electricity grid, and health.
- As an example, a circulation-induced 1985-like cold spell in today’s climate would likely stand at around -9°C over France for minimum temperatures, which would still be amongst the 5-10 coldest cold spells observed in the past five decades.
Potential tensions on the electricity supply chain have been much discussed for the coming winter, due to various contexts in Europe (geopolitical, technical and as a consequence of the Covid-19 crisis). If a cold spell occurs, such tensions could be exacerbated. Remarkable past cold spells have pounded Western Europe, such as in 1956, 1963, 1985 and 2012, with major impacts. Figure 1 shows, for instance, the winter minimum of the daily minimum temperature averaged over 15 consecutive days for both Germany and France. During the cold spells mentioned above, temperatures departed from the usual minimum by ~10°C, reaching values around -15°C for 2-week averages over Germany. Such cold spells this coming winter could have major impacts on health, and cascading impacts from potential blackouts due to electric grid tension.
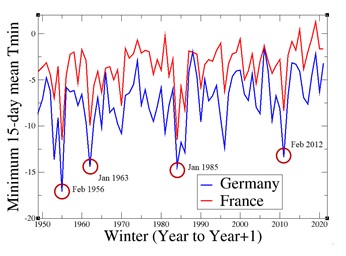
Figure1. Minimum, for each winter, of the 15-day averaged minimum daily temperature, averaged over Germany and France, as examples; data from the E-OBS dataset[1]
Close relationships between electricity and gas demand have been found in European countries[2] (Thornton et al., 2016). For example, the relatively recent winter 2009/10 in the UK and Western Europe has been a cold extreme in a warming climate (Cattiaux et al. 2010), and the winter electricity and gas demand increased by about 2.3% and 8% above climatology, respectively.
What causes cold spells in Western Europe
Cold spells in Western Europe result from specific atmospheric circulation patterns. Particularly important are anticyclonic conditions over North Western Europe, extending sometimes to a large fraction of the Eurasian continent. This induces North-Easterly winds and dry conditions, conducive to a transport of cold air from either polar or Siberian origin. These conditions may be exacerbated by excessive radiative cooling, strong temperature inversion layers, and in the presence of snow, a large albedo reflecting solar radiation. Such conditions together then lead to a large drop in temperature and are called “winter blocking conditions”, because the anticyclone can block oceanic, mild, weather systems from penetrating over the continent.
So-called “blocking” conditions lead to more stationary atmospheric flow and can persist for a few weeks[3], which may deepen the effects of the cold spells further. Different remote drivers of the climate system might create favorable conditions for blocking. In particular, blocking occurrence has been shown to often have precursors in the stratosphere, with weak stratospheric polar vortex states leading to cold spells over Eurasia[4].
The evolution of cold spells under climate change
The IPCC assessment of cold spells and extremes is done in Chapters 11 and 12 of the WGI 6th Assessment Report. It states that “It is virtually certain that the frequency and intensity of cold extremes has decreased on the global scale since 1950, and human-induced greenhouse gas forcing is the main driver of the observed changes (IPCC AR6, Chapter 11)”. Cold extremes are projected to further decrease in intensity and frequency at the global scale. In all AR6 regions, a decrease in cold extremes has been observed, and human influence very likely contributed to the observed decrease in the intensity and frequency of cold extremes.”
The science behind this is well established. Increases in the concentration of greenhouse gases leads to direct warming of the surface air (a direct thermodynamical effect), mediated by feedback processes. For example, reduced seasonal snow cover has likely regionally amplified the decreases in cold extremes, and a weakened north-south temperature gradient further contributes to decreases in cold extremes over Europe due to reduced cold air transport. Conversely, changes in atmospheric dynamics that may affect winter circulation variability, or cold spells specifically, are much less certain[5]. Importantly, persistent blocking anticyclones responsible for cold extremes are a priori as likely today as they were in past decades.
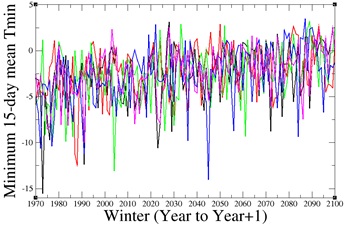
Current climate projections also indicate that, despite a global and regional warming trend, departures of 10-15°C below normal values are still possible and will be possible for decades to come. This is shown by several regional climate simulations (Figure 2).
What past cold spells would look like today
We illustrate how cold spells of past European winters would look like in today’s climate. The main contributor to winter temperature variability over Europe on daily to seasonal time scales is atmospheric circulation variability[8]. So-called dynamical adjustment techniques have been developed to separate the influence of circulation-induced climate variability on temperature, from a residual that is unexplained by circulation and expected to contain thermodynamical components[9]. Here, we apply a dynamical adjustment methodology that estimates circulation-induced temperature variability based on statistical learning, using the sea level pressure field as a circulation proxy[10]. The method setup has been applied to explain the evolution of winter temperatures over Switzerland over the last decades[11], and we follow a near-identical procedure[12].
Circulation-induced variability shows a Pearson correlation of R = 0.91 with the observed, detrended time series of the coldest 15 days over France (and even higher, R = 0.95 for seasonal averages), thus explaining a substantial fraction of temperature variability (Fig. 3a). A large trend remains in the residuals, which represents the temperature variations that cannot be explained by the atmospheric circulation (Fig. 3b). The 1985-reference case was about -10.6°C over 15 days on average over France, and was driven by unusual circulation variability (Fig. 3a). The long-term linear trend has added about 1.4°C, on average, between 1985 and 2022.
Hence, a circulation-induced 1985-like cold spell in today’s climate would likely stand at around -9.2°C, which would still be amongst the coldest cold spells observed over France in the past five decades (Fig. 3a).
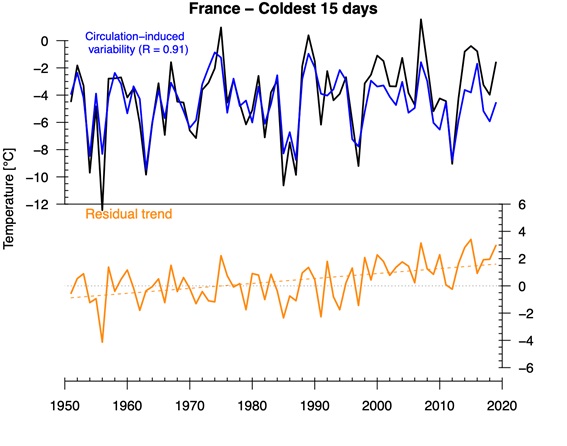
Figure 3. Top: Temperature [°C] during the coldest 15 day period each year in ERA5 for the France region (black). Blue line indicates the temperature variability related to atmospheric circulation (explained by sea level pressure proxy). Bottom: Residual temperature trend (shown as a temperature anomaly) when the circulation-induced temperature variability is subtracted from the raw time series.
Cold spells studied by XAIDA
Disentangling the combination of causes of cold extremes is a key part of XAIDA research. Our aim is to better understand and quantify the large-scale circulation patterns responsible for winter cold spells in Europe and assess their impacts on ecology and renewable energy. To achieve this we use new methods to understand the impacts of persistent circulation regimes and to study the interplay of atmospheric circulation regimes with global warming. This will help to build storylines of future cold extremes under different climate change scenarios, together with the role of atmospheric circulations.
Notes
[1] Haylock, M. R., N. Hofstra, A. M. G. K. Tank, E. J. Klok, P. D. Jones, and M. New, 2008: A European daily high-resolution gridded data set of surface temperature and precipitation for 1950-2006. J. Geophys. Res. – Atmospheres, 113, doi:10.1029/2008JD010201.
[2] Thornton, H. E., Hoskins, B. J., & Scaife, A. A. (2016). The role of temperature in the variability and extremes of electricity and gas demand in Great Britain. Environmental Research Letters, 11(11), 114015.
[3] Charney, J. G., & DeVore, J. G. (1979). Multiple flow equilibria in the atmosphere and blocking. Journal of Atmospheric Sciences, 36(7), 1205-1216.
Vautard, R., & Legras, B. (1988). On the source of midlatitude low-frequency variability. Part II: Nonlinear equilibration of weather regimes. Journal of the atmospheric sciences, 45(20), 2845-2867.
[4] Kretschmer, M., Coumou, D., Agel, L., Barlow, M., Tziperman, E. and Cohen, J. (2018). More-persistent weak stratospheric polar vortex states linked to cold extremes. Bulletin of the American Meteorological Society, 99(1), 49-60.
[5] Shepherd, T. G. (2014). Atmospheric circulation as a source of uncertainty in climate change projections. Nature Geoscience, 7(10), 703-708.
[6] Jacob, D., Petersen, J., Eggert, B., Alias, A., Christensen, O. B., Bouwer, L. M., … & Yiou, P. (2014). EURO-CORDEX: new high-resolution climate change projections for European impact research. Regional environmental change, 14(2), 563-578.
[7] Bartok, B., Tobin, I., Vautard, R., Vrac, M., Jin, X., Levavasseur, G., … & Saint-Drenan, Y. M. (2019). A climate projection dataset tailored for the European energy sector. Climate services, 16, 100138.
[8] Cattiaux, J., Vautard, R., Cassou, C., Yiou, P., Masson-Delmotte, V., & Codron, F. (2010). Winter 2010 in Europe: A cold extreme in a warming climate. Geophysical Research Letters, 37(20).
[9] Deser, C., Terray, L., & Phillips, A. S. (2016). Forced and internal components of winter air temperature trends over North America during the past 50 years: Mechanisms and implications. Journal of Climate, 29(6), 2237-2258.
[10] Sippel, S., Meinshausen, N., Merrifield, A., Lehner, F., Pendergrass, A.G., Fischer, E. and Knutti, R., 2019. Uncovering the forced climate response from a single ensemble member using statistical learning. Journal of Climate, 32(17), pp.5677-5699
[11] Sippel, S., Fischer, E.M., Scherrer, S.C., Meinshausen, N. and Knutti, R., 2020. Late 1980s abrupt cold season temperature change in Europe consistent with circulation variability and long-term warming. Environmental Research Letters, 15(9), p.094056
[12] Technical details are explained in the paper (ref. 10). The only difference is that the training setup for the 15-day cold periods makes use of a weighting scheme to put more weight on past periods with colder temperatures, which improves the performance of the algorithm.
![]() This project has received funding from the European Union’s Horizon 2020 research and innovation programme under grant agreement No 101003469.
This project has received funding from the European Union’s Horizon 2020 research and innovation programme under grant agreement No 101003469.