How can we attribute weather extremes to climate change?
Tamara Happé, Clair Barnes, Robin Noyelle, Sjoukje Philip, Ted Shepherd and the XAIDA team
Key messages
- Climate change is altering the frequency and/or intensity of extreme weather events. The aim of attribution science is to determine how climate change has affected a specific extreme event or trends in variables.
- Within the XAIDA project different institutions work on attribution science for extreme events, with the three main techniques being: unconditional probabilistic analysis, circulation analogues, and the storyline approach. The approaches range from probabilistic methods to deterministic ones, using data from observational sources as well as climate model simulations.
- With probabilistic attribution methods we are able to estimate the change in intensity and/or probability of occurrence of a class of extreme weather events (e.g. 3-day average maximum daily temperature over a particular region for a heatwave). Moving towards deterministic approaches, we are able to say more about dynamical changes and the causal chain leading up to the particular extreme weather event.
- By interpreting the results of these complementary methods together, we increase our confidence in the findings of each study.
Introduction
With climate change we see an increase in extreme weather events around the globe; occurrences of floods, heatwaves, and droughts [1]. Within XAIDA, we aim to determine to what extent human induced climate change has altered the probability of occurrence and/or intensity of an extreme weather event, also known as attribution science. Several institutions work on attribution science, using different but complementary methodological frameworks. In this brief we explain the three main approaches used within XAIDA: unconditional probabilistic analysis, circulation analogues, and the storyline approach.
Unconditional probabilistic analysis: World Weather Attribution
The World Weather Attribution (WWA) approach defines the weather event of interest based on the experienced impacts. First, the extent of the event is defined, both in space and time. This allows the event to be summarized with a single index, e.g. 3-day average maximum daily temperature over a particular region for a heatwave. Then, a statistical model is used to describe the relationship between this index and the global mean surface temperature (GMST), a proxy for climate change. This relationship is used to estimate how often such an event is expected to occur, usually expressed as a ‘return time’; an event with a return time of 100 years has a 1% chance of occurring in any given year. The return time is estimated for both the present climate and a cooler pre-industrial climate. Then, the change in return time tells us how much more (or less) likely it is that such an event will occur, due to climate change. The statistical model is also used to report the expected change in intensity due to climate change.
This statistical analysis is carried out for both observational datasets and climate models. The combined results are synthesized into a single attribution statement, including uncertainty estimates. The full WWA protocol [2] also includes a qualitative assessment to assess the influence that the vulnerability and exposure of the local population had on the impacts, which is critical to support adaptation measures.
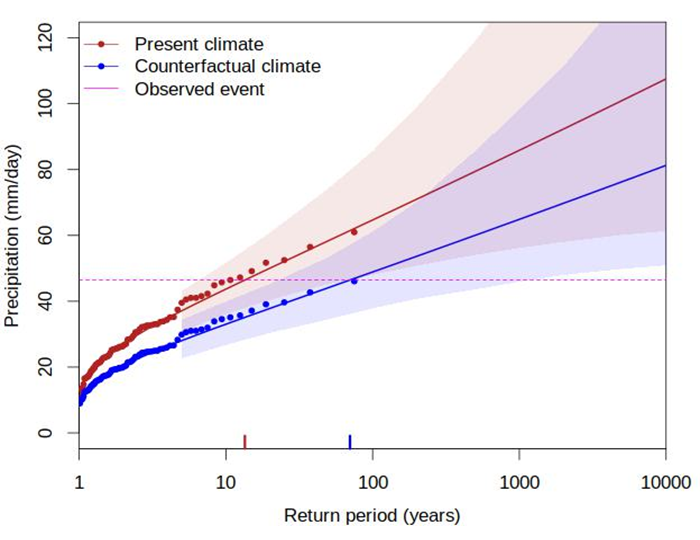
Figure 1 – Part of the WWA assessment. Return periods of 4-day accumulated precipitation over Greece, Bulgaria and Turkey estimated from the statistical model (here, a GEV) in the present day (red line) and pre-industrial climate (blue line). The purple line is the observed extreme precipitation event. The red and blue ticks show the expected return period of an event like the one observed in both climates. From [3]
Circulation Analogues: ClimaMeter
The ClimaMeter framework uses the flow analogue method as described in [4]. First, a variable of interest is defined associated with the extreme weather event observed, e.g. temperature for a heatwave. Then, this variable of interest is compared in two different worlds (the past and present day), conditional on the observed atmospheric circulation pattern of the extreme event. The ClimaMeter framework aims to answer the question: how does a similar large-scale atmospheric circulation pattern in the two different worlds affect the variable of interest? This atmospheric circulation pattern is defined over the relevant region for the observed extreme event; an example is shown in Fig 2, for the extreme precipitation in Greece in the summer of 2023.
Then, to compare the event in two different worlds, events with a similar atmospheric circulation pattern as the extreme event (i.e. analogues) are found in two different worlds: the “past” (1979-2001) and the “present” (2001-2022). If the difference between the two worlds is statistically significant, it can be concluded that a similar large-scale atmospheric circulation pattern leads to changes in the event from the past to the present world. This method explicitly disentangles the role of thermodynamics and dynamics, by conditioning the attribution on the atmospheric dynamics of the event. Through this conditioning, the method is more specific to the event and the associated impacts than the unconditional probabilistic approach.
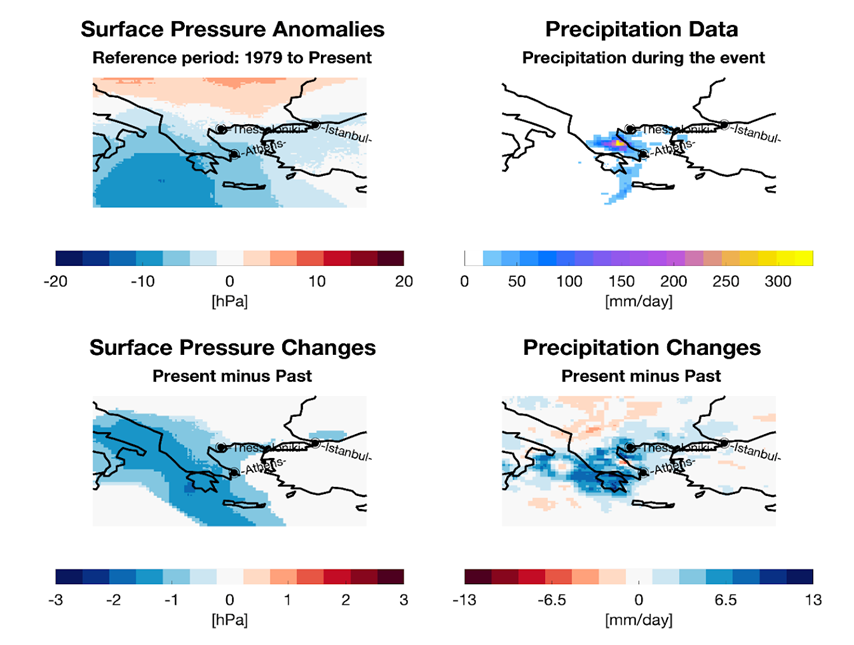
Figure 2 – Part of an assessment by ClimaMeter, showing the surface pressure anomalies and the variable-of-interest anomalies (here precipitation) in the top row. The bottom row shows the influence of climate change on the event through dynamics, as the difference between the present world and the past world.
Event-based storyline approaches
Another approach used to calculate the effects of climate change on an extreme event is through the use of storylines. Storylines are particularly useful to assess potential climate change related impacts in the context of deep uncertainty. The storyline approach identifies the causal chain of factors leading to the extreme event and assesses the role of each of these factors, allowing for the possibility of conditional rather than unconditional attribution [5, 6]. The simplest version of the approach is to estimate how an observed event would have looked like in different climates. Since every event is unique, this analysis cannot be done using observations. Instead it is done by simulating the extreme event within a weather or climate model, with different climates as background conditions, thereby creating different storylines of the extreme event.
There are different ways to model the events, such as: using short-term weather forecasts [7], spectral nudging of the large-scale circulation [8], or data assimilation [9]. The storyline approach is useful for assessing a specific extreme event, and the outcomes are only applicable for that specific event. This is especially useful for risk assessments, by e.g. using the storyline in the future as a benchmark for adaptation questions.
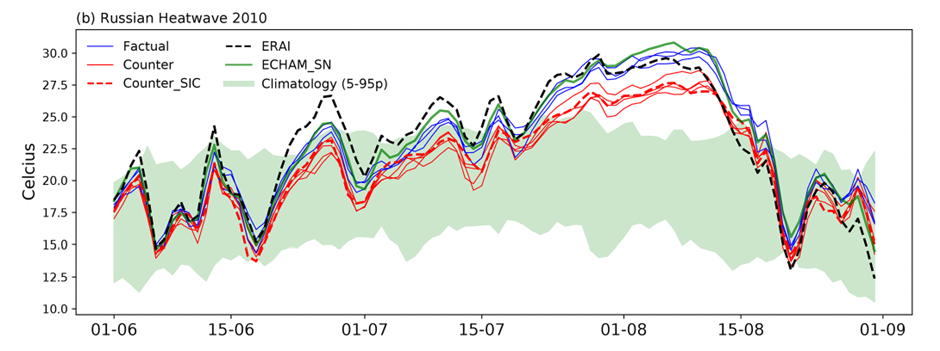
Figure 3 – A storyline attribution of the Russian heatwave of 2010, using spectral nudging of the large-scale circulation.
The blue lines show three factual simulations, the red lines three counterfactual simulations representing pre-industrial conditions, and the green shading the 90th percentile climatology. This shows that even without climate change the heat wave would have been exceptional, but was exacerbated by more than 2°C by climate change during its peak. From van Garderen et al. (2021) [8].
Concluding remarks
Attribution science plays an important role for litigation, adaptation questions, and Loss & Damage funds. XAIDA is working together with scientists and stakeholders to further strengthen attribution sciences, both in its methods and applications. By interpreting the results of complementary methods together, we improve our understanding of the underlying physical processes and of the role of climate change in modifying extreme weather events, increasing our confidence.
Notes
[1] Seneviratne, S.I., X. Zhang, M. Adnan, W. Badi, C. Dereczynski, A. Di Luca, S. Ghosh, I. Iskandar, J. Kossin, S. Lewis, F. Otto, I. Pinto, M. Satoh, S.M. Vicente-Serrano, M. Wehner, and B. Zhou, 2021: Weather and Climate Extreme Events in a Changing Climate. In Climate Change 2021: The Physical Science Basis. Contribution of Working Group I to the Sixth Assessment Report of the Intergovernmental Panel on Climate Change [Masson-Delmotte, V., P. Zhai, A. Pirani, S.L. Connors, C. Péan, S. Berger, N. Caud, Y. Chen, L. Goldfarb, M.I. Gomis, M. Huang, K. Leitzell, E. Lonnoy, J.B.R. Matthews, T.K. Maycock, T. Waterfield, O. Yelekçi, R. Yu, and B. Zhou (eds.)]. Cambridge University Press, Cambridge, United Kingdom and New York, NY, USA, pp. 1513–1766, doi:10.1017/9781009157896.013
[2] Philip, S., Kew, S., van Oldenborgh, G. J., Otto, F., Vautard, R., van der Wiel, K., King, A., Lott, F., Arrighi, J., Singh, R., and van Aalst, M.: A protocol for probabilistic extreme event attribution analyses, Adv. Stat. Clim. Meteorol. Oceanogr., 6, 177–203, https://doi.org/10.5194/ascmo-6-177-2020, 2020.
[3] Zachariah, M., Kotroni, V., Kostas, L., Barnes, C., Kimutai, J., Kew, S., Pinto, I., Yang, W., Vahlberg, M., Singh, R. and Thalheimer, D., 2023. Report: Interplay of climate change-exacerbated rainfall, exposure and vulnerability led to widespread impacts in the Mediterranean region. https://doi.org/10.25561/106501
[4] Faranda, D., Bourdin, S., Ginesta, M., Krouma, M., Noyelle, R., Pons, F., Yiou, P., and Messori, G.: A climate-change attribution retrospective of some impactful weather extremes of 2021, Weather Clim. Dynam., 3, 1311–1340, https://doi.org/10.5194/wcd-3-1311-2022, 2022
[5] Shepherd, T.G. A Common Framework for Approaches to Extreme Event Attribution. Curr Clim Change Rep 2, 28–38 (2016). https://doi.org/10.1007/s40641-016-0033-y
[6] Lloyd, E.A. and Shepherd, T.G.: Foundations of attribution in climate-change science. Env. Res. Clim., 2, 035014, https://doi.org/10.1088/2752-5295/aceea1, 2023.
[7] Reed, K.A. and Wehner, M.F.: Real-time attribution of the influence of climate change on extreme weather events: a storyline case study of Hurricane Ian rainfall. Environ. Res.: Climate, 2, 043001, https://doi.org/10.1088/2752-5295/acfd4e, 2023.
[8] van Garderen, L., Feser, F. and Shepherd, T.G.: A methodology for attributing the role of climate change in extreme events: A global spectrally nudged storyline. Nat. Hazards Earth Syst. Sci., 21, 171–186, https://doi.org/10.5194/nhess-21-171-2021, 2021.
[9] Hawkins, E., Brohan, P., Burgess, S., Burt, S., Compo, G., Gray, S., Haigh, I., Hersbach, H., Kuijjer, K., Martinez-Alvarado, O., McColl, C., Schurer, A., Slivinski, L., and Williams, J.: Quantifying windstorm risks by translating historical extreme events into the future, EGU General Assembly 2023, Vienna, Austria, 24–28 Apr 2023, EGU23-9290, https://doi.org/10.5194/egusphere-egu23-9290, 2023.
![]() This project has received funding from the European Union’s Horizon 2020 research and innovation programme under grant agreement No 101003469.
This project has received funding from the European Union’s Horizon 2020 research and innovation programme under grant agreement No 101003469.