PAPER: HEAT EXTREMES IN WESTERN EUROPE WARMED FASTER THAN SIMULATED
The paper led by Robert Vautard is a team effort across the XAIDA project and beyond, especially in collaboration with teams of Meteo France, including Julien Cattiaux, Tamara Happé, Jitendra Singh, Rémy Bonnet, Christophe Cassou, Dim Coumou, Fabio D’Andrea, Davide Faranda, Erich Fischer, Aurélien Ribes, Sebastian Sippel & Pascal Yiou.
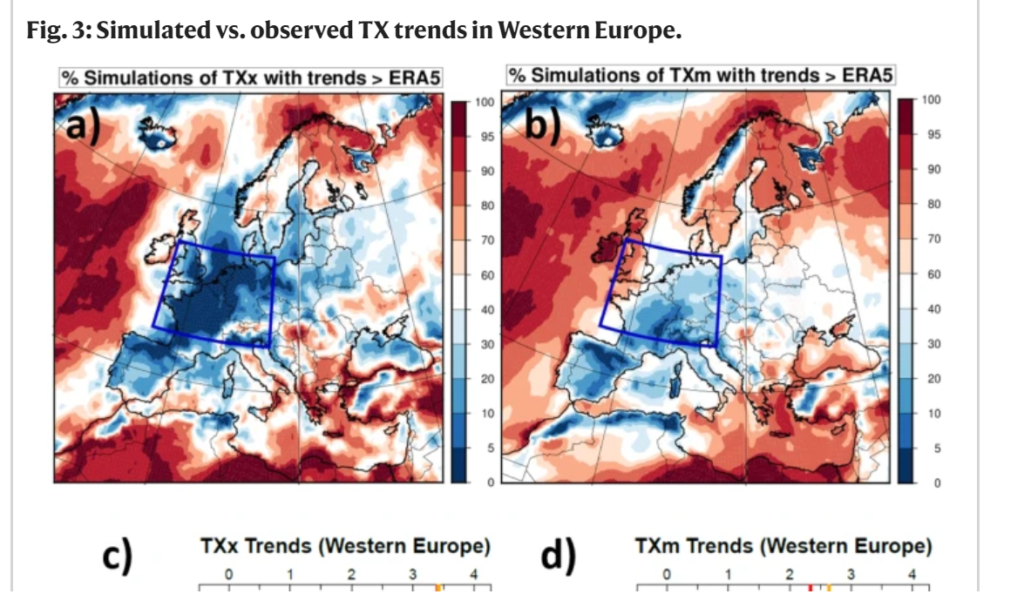
A recent paper entitled « Heat extremes in Western Europe increasing faster than simulated due to atmospheric circulation trends » published in Nature Communications shows that « over the last 70 years, extreme heat has been increasing at a disproportionate rate in Western Europe, compared to climate model simulations. This mismatch is not well understood ». This article « (…) show that a substantial fraction (…) of the heat extremes trend is induced by atmospheric circulation changes, through more frequent southerly flows over Western Europe ».
Reference: Vautard, R., Cattiaux, J., Happé, T. et al. Heat extremes in Western Europe increasing faster than simulated due to atmospheric circulation trends. Nat Commun 14, 6803 (2023). https://doi.org/10.1038/s41467-023-42143-3

Figure – extract from figure 3 of the Nature Communications article: https://www.nature.com/articles/s41467-023-42143-3
According to Robert Vautard, this paper tries to explain (i) the outstanding increase in intensity of heat extremes in Western Europe, unfortunately Western Europe has the worldwide gold medal in extreme heat increase, and (ii) why CMIP6 climate simulations show less increase and (iii) why curiously this leads to unbelieveable uncertainty for the future and adaptation needs.
We have more and more summertime southerly flows with low-pressure systems in the East Atlantic and anticyclone over Europe.
This explains a significant part, but not all, of the outstanding increase in extremes and models underestimates. Thermodynamics also appears to play a role.
If this dynamical trend is a climate-change forced signal, it is likely that the high trend continues. If not, the trend may weaken.
